RTX 4080 baselines
Every number on this page was measured on the machine described below by the command printed next to it. Nothing is estimated, interpolated or scaled from another device. Where a configuration was tried and failed, or was not tried at all, it says so rather than being omitted.
The primary schema-v2 comparison repeats every arm at two prespecified seeds; older GPU artifacts are single-seed. No statistical significance is claimed anywhere on this page.
The machine
| item | value | how it was read |
|---|---|---|
| GPU | NVIDIA GeForce RTX 4080, 16376 MiB, driver 596.49 | nvidia-smi --query-gpu=name,memory.total,driver_version --format=csv |
| reported by torch | 15.992 GiB usable, capability 8.9 | torch.cuda.get_device_properties(0) |
| OS | Windows 11 Pro 10.0.22631 | platform.platform() |
| Python | CPython 3.12.13 | sys.version |
| torch | 2.13.0+cu130 | torch.__version__ |
| transformers | 5.14.1 | importlib.metadata.version |
| peft | 0.19.1 | idem |
| bitsandbytes | 0.50.0 | idem |
The same block is written into manifest.json for every run, so a result file
carries its own provenance.
Models
Both Apache-2.0, both pinned by revision, tokenizer byte-identical
(sha256 aeb13307a71acd8fe81861d94ad54ab689df773318809eed3cbe794b4492dae4):
| role | model | revision |
|---|---|---|
| student | Qwen/Qwen3-0.6B |
c1899de289a04d12100db370d81485cdf75e47ca |
| teacher | Qwen/Qwen3-1.7B |
70d244cc86ccca08cf5af4e1e306ecf908b1ad5e |
Parameter counts as loaded, from manifest.json:
| model | configuration | num_parameters |
num_trainable_parameters |
|---|---|---|---|
| student | NF4 + LoRA r=16 on 7 projections | 385,941,504 (NF4-packed) | 10,092,544 |
| teacher | bf16, frozen | 1,720,574,976 | 0 |
Memory
Measured by torch.cuda.max_memory_allocated and max_memory_reserved, with
the counters reset immediately before the phase.
python scripts/gpu_smoke.py \
  --recipe recipes/qwen_consumer_gpu_calc_raw_teacher.yaml \
  --output runs/gpu-smoke
| quantity | value |
|---|---|
| peak allocated | 4.251 GiB |
| peak reserved | 4.762 GiB |
| resolved memory strategy | resident |
| reason recorded | "auto -> resident: a quantized model cannot be moved off the accelerator, so swap is unavailable" |
| projection chunk size | 256 (unchanged) |
| OOM retries used | 0 |
Configuration that produced it:
recipes/qwen_consumer_gpu_calc_raw_teacher.yaml with
train.cycles: 1, rollouts_per_cycle: 2, sft_warmup_cycles: 1,
max_new_tokens_per_turn: 48, environment.train_tasks: 16, eval.tasks: 2.
Two things this number depends on, both of which the recipe controls:
loss.chunk_size: 256bounds the largest vocabulary-sized tensor at[256, 151936]fp32, which is 148 MiB. A full-sequence logit tensor atmax_total_tokens: 704would be 408 MiB per forward and would also have to be kept for the backward pass. miniVERL never builds it.selection.selector: hybridatratio: 0.6reduces the number of positions that reach the LM head at all.
The card has 16 GiB, so 11.2 GiB of headroom remained. That is a measurement, not a recommendation: it means the pair is comfortably inside the budget, and larger teachers or longer sequences have room.
Decode throughput
64 new tokens after a 36-token prefix, one sequence, LoRA r=16 attached:
| student | deterministic algorithms | tok/s | peak allocated |
|---|---|---|---|
| NF4 + bf16 compute | on | 11.19 | 0.862 GiB |
| NF4 + bf16 compute | off | 11.29 | 0.862 GiB |
| bf16, no quantization | on | 12.84 | 1.170 GiB |
| bf16, no quantization | off | 14.12 | 1.170 GiB |
Two findings worth stating plainly, because they change how you should read every wall-clock number on this page:
- NF4 costs about 20% of decode throughput here and saves ~0.3 GiB on a 0.6B student. On this pair quantization is not what makes the recipe fit; it is the path that scales to a larger teacher. The recipe defaults to NF4 for that reason, and the trade-off is recorded in the recipe comments.
- Decoding is kernel-launch bound, not compute bound. A 14-token prefill
costs 37.0 ms while a cached single-token step costs 30.9 ms — the
two are within 20% of each other, which is only possible if the GPU is idle
waiting on dispatch. For reference, the LM head on one position takes
0.48 ms,
tokenizer.decodeof 64 ids takes 0.02 ms, and copying a 151936-float tensor to the host takes 0.11 ms, so none of miniVERL's own per-token work explains the 30 ms.
Windows uses the WDDM driver model, whose per-launch overhead is well known to be higher than Linux's. This was not measured on Linux, so the claim here is only that the bottleneck is dispatch on this machine. A Linux run would plausibly be faster; that is a prediction, not a result.
The published recipe, end to end
| quantity | value |
|---|---|
| optimizer steps | 16 (8 supervised cold start + 8 on-policy cycles) |
| wall clock | 481.1 s |
| held-out greedy success | 0.0% -> 100.0% on 12 tasks |
| average turns after training | 2.00 |
| rollout throughput during training | 9.95 - 10.47 tok/s |
| policy versions | 9 |
Read this honestly. The supervised cold start does most of the work: the
very first on-policy rollout batch already scored 83.3%, and the eval at
cycle 4 was already 100%. The medium calculator split saturates, so this run
demonstrates that the pipeline works end to end on real hardware — it does
not demonstrate that on-policy distillation beats supervised fine-tuning.
The next section is the experiment that tests that question.
Per-cycle rollout success during the on-policy phase: 0.83, 1.00, 1.00, 1.00, 1.00, 0.83, 1.00, 1.00.
Protocol-teacher equal-update comparison (schema v2)
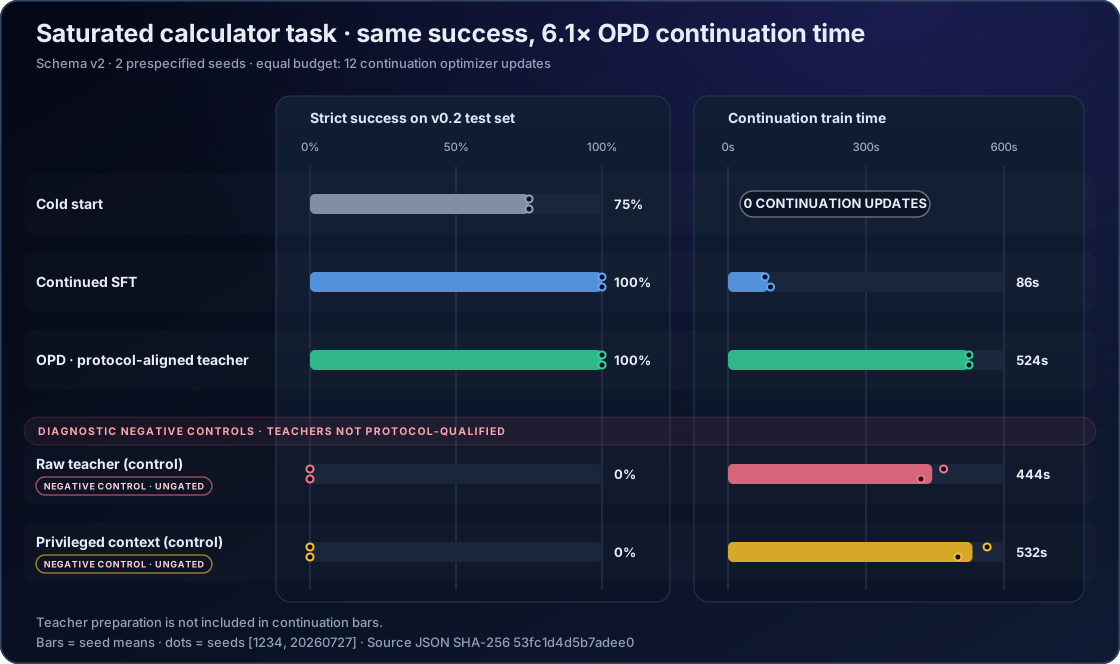
The v0.2 experiment removes the legacy comparison's largest confound. Candidate A fine-tuned the pinned Qwen3-1.7B teacher for 24 optimizer updates on verified oracle traces in the student's exact tool protocol. Its independent held-out policy evaluation reached 100% strict success on 24 tasks and passed the prespecified 50% gate, so the fallback candidates were not run.
The benchmark then trained a separate shared hard cold start for each of two
prespecified seeds. Every continuation arm loaded that seed's identical weights
without optimizer state and received 12 optimizer updates. The declared
comparison axis is therefore optimizer steps, not wall time or teacher
compute.
| arm | seed 1234 | seed 20260727 | mean train seconds |
|---|---|---|---|
| cold-start-only | 75.0% | 75.0% | 0.1 |
| sft-continued | 100.0% | 100.0% | 86.4 |
| opd-raw-teacher | 0.0% | 0.0% | 444.0 |
| opd-privileged-context | 0.0% | 0.0% | 531.5 |
| opd-protocol-sft-teacher | 100.0% | 100.0% | 523.8 |
The strict success column is primary. The protocol-teacher arm also had 100% lenient success, valid tool-call rate and final-answer format validity on both seeds. Raw and privileged teachers reproduced the collapse at 0%; their lenient diagnostic score was at most one task out of 24.
This result supports a narrower causal conclusion than either “OPD works” or “OPD fails”: a teacher competent in the deployed tool protocol prevents the collapse caused by protocol-naive supervision. It does not show an advantage over verified SFT, because the protocol-teacher OPD and SFT arms tie at 100% on both seeds. The task is also saturated after continuation, the evaluation set has only 24 tasks, and two seeds do not support a significance claim.
The schema-validated source is
benchmarks/results/gpu-calc-hard-equal-update-v2.json,
with a generated Markdown table.
Historical benchmark memory caveat
The published result's peak_allocated_bytes values were measured from live
tensors during each arm. Its peak_reserved_bytes values may also include CUDA
caching-allocator state retained from an earlier sequential arm because that
harness predated destructive trainer teardown. The success measurements are
unaffected, so the JSON remains byte-for-byte preserved. Future reserved-memory
comparisons must use the corrected lifecycle-isolated harness, which destroys
each trainer, collects dead references, and empties the allocator before the
next arm is loaded.
Legacy equal-update comparison (schema v1)
git checkout 3383f2b9a3c595e0fa143fecdc27522ab368b27f
miniverl benchmark benchmarks/configs/gpu_calc_hard.yaml --output runs/benchmarks
The original configuration is also retained for inspection at
benchmarks/configs/gpu_calc_hard_legacy_v1.yaml, but current miniVERL does not
execute schema-v1 benchmark configs. The checkout above is required to
reproduce the historical harness rather than accidentally running v2.
Continuation and evaluation ran on the less-saturated hard calculator split (compute an
expression, then convert the result — two dependent tool calls), because
medium saturates. Every arm resumed from the same 12-cycle supervised cold
start, weights only, and received the same 12 optimizer steps at a constant
learning rate of 5e-5. Evaluation was greedy on 24 held-out test tasks with a
fixed seed.
Erratum. The shared checkpoint itself was trained on medium, not hard.
The old harness built its controlled block from the base recipe, so that block
incorrectly reports medium, learning rate 1e-4, a cosine schedule and 48
test tasks even though continuation/evaluation used the settings above. Its
selected_training_tokens fields contain only the final cycle, not full-run
totals, and SFT's teacher-query ratio is meaningless because SFT queried no
teacher. The identical starting checkpoint across arms is unaffected. The JSON
is preserved as a legacy schema-v1 artifact; benchmark v2 fixes these semantics
without rewriting the measurement.
Results are in benchmarks/results/rtx4080-calc-hard-matched.json and the
Markdown table beside it.
What the first run showed, and why a fourth arm was added
The first execution of this benchmark had three arms and produced:
| arm | steps | held-out success |
|---|---|---|
| cold-start-only | 0 | 62.5% |
| sft-continued | 12 | 100.0% |
| opd-bucketed-k64 | 12 | 0.0% |
On-policy distillation did not merely fail to help; it destroyed the policy, ending with an 83.3% invalid-tool-call rate. The objective was not diverging — it fell monotonically from 2.33 to 0.84 across the twelve steps, and the mean teacher entropy on selected positions was about 0.03 nats, meaning the teacher was extremely confident about what the student should have said.
The student was faithfully imitating a teacher that has never seen the tool
protocol. Qwen/Qwen3-1.7B is the raw instruct checkpoint: it is a stronger
language model than the student, but it is not a stronger policy for this
task, and reverse KL against a confident, protocol-naive teacher unwinds exactly
the behaviour the cold start installed.
That reading makes a prediction: give the same teacher the answer, and it should
help instead of hurt. models.teacher.mode: privileged_context does precisely
that — the teacher sees an extra oracle block naming the verified answer that
the student never sees, following arXiv:2602.12275 — so a fourth arm was added
and the whole benchmark was re-run. Both runs are reported; the first was not
discarded.
Full results
| arm | steps | held-out success | avg turns | invalid calls | gen tok/task | seconds |
|---|---|---|---|---|---|---|
| cold-start-only | 0 | 62.5% | 2.00 | 0.0% | 42.0 | 89.4 |
| sft-continued | 12 | 100.0% | 2.38 | 0.0% | 50.2 | 450.4 |
| opd-bucketed-k64 | 12 | 0.0% | 2.00 | 83.3% | 38.5 | 684.8 |
| opd-privileged-context | 12 | 0.0% | 1.00 | 0.0% | 20.8 | 546.4 |
Generated table and machine-readable result:
benchmarks/results/rtx4080-calc-hard-matched.md and .json.
The prediction was wrong. Privileged context did not rescue on-policy distillation. It scored 0.0%, exactly like the standard teacher. Publishing that is the point of the arm: the hypothesis in the previous section was testable, it was tested, and it failed.
But the two arms did not fail the same way, and the difference is the actual result of this benchmark.
Reading the transcripts
Decoding the final evaluation of each arm — 24 held-out hard tasks, greedy —
shows three distinct behaviours:
sft-continued            <tool_call>{"arguments": {"expression": "(4 * 2)"}, "name": "calculator"}</tool_call>
                         <tool_call>{"arguments": {"value": 8.0, "from_unit": "km", "to_unit": "mi"},
                                     "name": "convert"}</tool_call>
                         <final>4.971</final>                                    <- solved

opd-bucketed-k64         {"name": "calculator", "arguments": {"expression": "4*2"}}
                         </tool_call><final><answer>8</answer></final>            <- no opening tag,
                                                                                     tool never ran

opd-privileged-context   <final><answer>4</answer></final>                        <- no tool call at all
Two separate defects, both inherited from the teacher:
Qwen/Qwen3-1.7Bwrites answers as<answer>…</answer>. That is its own convention, not the environment's. The verifier wants a bare number in<final>, so it recordsmalformed_answer: answer is not a number.- The standard teacher drops the opening
<tool_call>tag, which is why that arm reports an 83.3% invalid-tool-call rate — the emitted JSON is never parsed as a call, so the calculator never runs and the model "answers" with the unevaluated expression.
Separating presentation from capability
A single success rate cannot tell "cannot do the task" apart from "did the task
and wrote it down wrong". Re-scoring the same, already-collected trajectories
with a lenient parser that unwraps <answer> separates them:
| arm | strict (reported) | lenient | presentational failures | substantive failures |
|---|---|---|---|---|
| cold-start-only | 62.5% | 62.5% | 0 | 9 |
| sft-continued | 100.0% | 100.0% | 0 | 0 |
| opd-bucketed-k64 | 0.0% | 16.7% | 4 | 20 |
| opd-privileged-context | 0.0% | 0.0% | 0 | 24 |
The strict column is the reported metric. The lenient column is diagnostic and must never be quoted alone. What it establishes:
- For
opd-bucketed-k64, formatting explains 4 of 24 failures. The other 20 are real. Even scored generously it reaches 16.7%, far below the 62.5% it started from, so this arm genuinely damaged the policy. - For
opd-privileged-context, formatting explains none of it. Every one of the 24 failures is substantive.
Why privileged context made it worse, not better
avg turns fell to 1.00 and the invalid-call rate fell to 0.0%. The
policy is no longer malformed — it is confidently answering without using the
tool.
That is the expected failure of a privileged teacher, and it is the useful finding here. The oracle block tells the teacher the verified answer. A model that already knows the answer has no reason to emit a tool call, so the distribution it puts on the next token is "state the answer". The student matches that distribution faithfully — and then cannot execute it, because at evaluation time the student has no oracle block and does not know the answer.
Privileged-context distillation only works when the privileged information changes how well the teacher does the task, not whether it needs to do the task at all. Here the answer is exactly the thing the tool exists to compute, so leaking it removes the behaviour being taught. arXiv:2602.12275 is explicit that the oracle must not be sufficient on its own; this run is a concrete demonstration of what happens when it is.
What this benchmark does and does not show
It shows, on one seed, one task family, one model pair and a 12-step budget:
- supervised continuation on verified oracle traces took 62.5% -> 100.0%;
- on-policy distillation from a protocol-naive teacher took 62.5% -> 0.0%, and the objective fell monotonically the whole time, so this is imitation of a bad target rather than optimizer divergence;
- handing that teacher the answer removed tool use entirely.
It does not show that on-policy distillation is worse than supervised fine-tuning in general. Every arm here shares one confound: the teacher was never trained on the tool protocol. The schema-v2 experiment above has now tested that explanation: its protocol-trained teacher prevents the collapse and reaches 100% on both seeds, while still only tying SFT. The legacy result remains published because it records the adverse finding and the distinct raw versus privileged failure modes.
Both executions of this benchmark are reported. Neither was discarded, and no arm was re-run and re-reported after seeing its result.
Configurations that were tried and did not work
Recorded because a baselines page that only lists successes is not a baselines page.
| configuration | outcome |
|---|---|
memory.strategy: swap with an NF4 student |
Refused at config time. bitsandbytes 4-bit parameters are pinned to the device they were quantized on, so the student cannot be moved to host memory and back. The error names resident as the fix. |
loss.mode: exact_full_vocab with the Qwen3 pair and swap |
Refused. Persisting [positions, 151936] teacher targets exceeds the loss.exact_max_vocab: 8192 guard rail. Exact mode with a resident teacher is allowed, because the distribution is rebuilt one chunk at a time. |
The toy backend on the medium and hard calculator splits |
0.0% after 700 supervised steps. The toy models can only solve easy. This is why the CPU benchmark is a parity check and not a ranking. |
A 250-step supervised budget for recipes/toy_cpu.yaml |
0.0%. The toy student acquires the tool-call format long before it can copy operands; 600 steps reaches 91.7%. |
Still not run
| what | why | the exact command, for whoever has the hardware |
|---|---|---|
| Anything on Linux | No Linux machine with a CUDA GPU was available. The dispatch-bound finding above is therefore Windows-specific. | python scripts/gpu_probe_throughput.py |
| The JSON-navigation and SQLite recipes on real models | Only the calculator environment was run end to end on GPU. | miniverl train recipes/qwen_consumer_gpu_jsonnav.yaml |
| Any GPU other than an RTX 4080 | Only one card was available. | miniverl export-benchmark runs/<run-id> and open a pull request; see benchmarks/README.md |
Regression fixtures
The measurements above are pinned as assertions with deliberately loose tolerances, so that a change which quietly doubles memory or halves throughput fails a test rather than a code review:
tests/gpu/test_gpu_qlora.py::test_qlora_4bit_student_loads_trains_and_reports_memoryasserts the NF4 student plus one[4, 151936]chunk stays under 8 GiB allocated — roughly twice the measured 4.251 GiB.- The same test asserts the student reports
quantization == "nf4",lora is Trueandvocab_size == 151936. tests/gpu/test_gpu_qlora.py::test_the_pinned_pair_shares_one_tokenizerasserts the two pinned revisions still produce identical fingerprints and identical token ids for a probe string.tests/gpu/test_gpu_qlora.py::test_a_cuda_run_records_measured_memory_in_its_manifestasserts that a CUDA run reports a non-zero peak andmeasurement_status.cuda_metrics == "measured".
Run them with pytest -q -m gpu. They are deselected automatically when no CUDA
device is present, so they never turn CPU CI red.